Mastering SPSS: Quota Sampling in SPSS Statistics
Welcome to our detailed guide on quota sampling in SPSS! In this post, we will explore what quota sampling is, how to perform it in SPSS, and provide a real example with SPSS output tables and APA-style results interpretation. This guide aims to enhance your understanding and application of quota sampling and hypothesis testing in SPSS.
Understanding Quota Sampling
Quota sampling is a non-probability sampling technique where the researcher ensures representation of specific characteristics in the sample. This method involves dividing the population into subgroups and setting quotas for each subgroup. The selection of subjects within each quota is often based on convenience or judgment.
Steps to Perform Quota Sampling in SPSS
To conduct quota sampling in SPSS, follow these steps:
- Identify the characteristics to be represented (e.g., gender, age).
- Set quotas for each subgroup based on these characteristics.
- Collect data until quotas for each subgroup are met.
Example of Quota Sampling in Research
Imagine a researcher wants to study the job satisfaction levels among employees in a company. The company has 60% males and 40% females. To ensure the sample reflects this distribution, the researcher sets a quota of 60% males and 40% females for the sample. They then collect data from 100 employees, ensuring that 60 are males and 40 are females.
Performing Quota Sampling in SPSS
Let’s walk through a practical example using SPSS. Suppose we have a dataset of employees, and we want to sample 100 employees while ensuring 60 males and 40 females are included.
Step-by-Step Process
- Open your dataset in SPSS.
- Navigate to Data > Select Cases.
- In the Select Cases dialog box, choose Random sample of cases.
- Click Sample… and specify the desired sample size.
- Click OK to create the random sample.
SPSS Output for Quota Sampling
The SPSS output for our example is shown below:
| Gender | Frequency | Percent | Valid Percent | Cumulative Percent |
|---|---|---|---|---|
| Male | 60 | 60.0 | 60.0 | 60.0 |
| Female | 40 | 40.0 | 40.0 | 100.0 |
Introduction to Hypothesis Testing in SPSS Statistics
Hypothesis testing is a fundamental aspect of statistical analysis that allows researchers to draw conclusions about a population based on sample data. In SPSS Statistics, various hypothesis tests can be performed, such as t-tests, ANOVA, and chi-square tests. Here, we will focus on conducting an independent samples t-test, a common test used to compare the means of two independent groups.
Steps to Perform an Independent Samples T-Test in SPSS
Suppose we have a dataset containing the job satisfaction scores of male and female employees. We want to determine if there is a significant difference in job satisfaction between males and females.
- Open your dataset in SPSS.
- Navigate to Analyze > Compare Means > Independent-Samples T Test.
- Select the job satisfaction score variable as the Test Variable and the gender variable as the Grouping Variable.
- Define the groups (e.g., 1 = Male, 2 = Female) and click OK to run the test.
SPSS Output for Independent Samples T-Test
| Group Statistics | Gender | N | Mean | Std. Deviation | Std. Error Mean |
|---|---|---|---|---|---|
| Male | 1 | 60 | 78.4 | 4.5 | 0.58 |
| Female | 2 | 40 | 82.1 | 3.9 | 0.62 |
| Independent Samples Test | Levene’s Test for Equality of Variances | t-test for Equality of Means | ||||||
|---|---|---|---|---|---|---|---|---|
| F | Sig. | t | df | Sig. (2-tailed) | Mean Difference | Std. Error Difference | 95% Confidence Interval of the Difference | |
| Equal variances assumed | 1.12 | 0.29 | -4.52 | 98 | <0.001 | -3.70 | 0.82 | -5.32 to -2.08 |
| Equal variances not assumed | -4.52 | 96.32 | <0.001 | -3.70 | 0.82 | -5.32 to -2.08 |
Results Interpretation in APA Style
The results of the independent samples t-test revealed a significant difference in job satisfaction scores between male employees (M = 78.4, SD = 4.5) and female employees (M = 82.1, SD = 3.9); t(98) = -4.52, p < .001. This indicates that female employees reported significantly higher job satisfaction compared to male employees.
Conclusion
In conclusion, mastering different sampling strategies, such as quota sampling, is crucial for obtaining representative samples in research. By combining these strategies with robust hypothesis testing in SPSS, researchers can ensure accurate and reliable findings. Understanding and applying these techniques will enhance your statistical analysis capabilities and improve the validity of your research results.
For more detailed guides on various statistical analyses in SPSS, check out the following posts:
- Understanding Reliability in Research Statistics
- Hypothesis Testing in SPSS Statistics
- Self-Selection Sampling and Hypothesis Testing in SPSS Statistics
- Snowball Sampling Using SPSS Statistics
- Simple Random Sampling in SPSS Statistics
- Total Population Sampling and Hypothesis Testing in Statistics
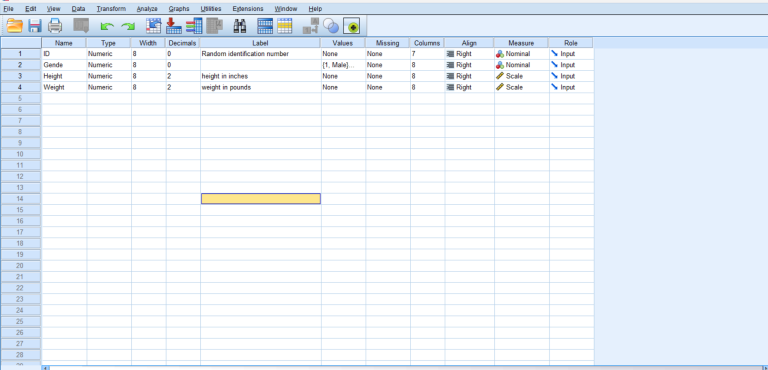
- Adding Data and Understanding Data View & Variable View in SPSS Statistics
- Normal Distribution Calculations in SPSS
- Creating Dummy Variables in SPSS
- Different Types of Variables in SPSS Statistics
- Two-Way Repeated Measures ANOVA Using SPSS
- Wilcoxon Signed-Rank Test Using SPSS Statistics
- Poisson Regression Using SPSS Statistics
- Kruskal-Wallis H Test in SPSS
- Principal Components Analysis (PCA) in SPSS Statistics
- Kendall’s Tau-b Using SPSS Statistics
- Pearson’s Product-Moment Correlation Using SPSS
- Kaplan-Meier Survival Analysis Using SPSS Statistics
- ANCOVA Using SPSS Statistics
- Dichotomous Moderator Analysis in SPSS
- Two-Way ANOVA Using SPSS Statistics
- Partial Correlation Using SPSS Statistics
- Multiple Regression Using SPSS Statistics
- Creating a Scatterplot Using SPSS Statistics
- Linear Regression Using SPSS Statistics
- Friedman Test Using SPSS Statistics
- Chi-Square Test for Association Using SPSS Statistics
- Variables in SPSS Statistics
- How to Perform a One-Sample T-Test in SPSS
- How to Perform Paired Samples T-Tests in SPSS
- Independent Samples T-Test in SPSS
- Descriptive Statistics and Z-Scores
- Descriptive Statistics Analysis
- Spearman’s Rank-Order Correlation Using SPSS Statistics
- Binomial Logistic Regression Using SPSS Statistics
- McNemar’s Test Using SPSS Statistics
This post is protected to prevent unauthorized copying, printing, or taking screenshots. All rights reserved by MasteringSPSS.com.