Understanding the different types of variables is fundamental in statistics. This guide will explore the roles of dependent and independent variables, the nature of experimental and non-experimental research, and how to categorize variables as either categorical or continuous. Additionally, we will discuss how to analyze these variables using SPSS, complete with real-world examples and detailed interpretations.
Dependent and Independent Variables
In any statistical analysis, it is crucial to distinguish between dependent and independent variables. Dependent variables are those that we aim to explain or predict, whereas independent variables are those that are believed to influence the dependent variable.
- Dependent Variable: The outcome that researchers aim to predict or explain. For example, in a study on educational performance, the dependent variable could be test scores.
- Independent Variables: Variables that are hypothesized to affect the dependent variable. In the same study, these could include revision time and intelligence.
In our example, the study aims to understand how revision time and intelligence affect test scores.
Example Study: Impact of Revision Time and Intelligence on Test Scores
Consider a study where researchers want to determine if increasing revision time and intelligence levels among students will improve their test scores. Here, test scores are the dependent variable, while revision time and intelligence are independent variables.
Experimental vs. Non-Experimental Research
Experimental Research
In experimental research, the researcher manipulates one or more independent variables and measures their effect on the dependent variable. For example, varying the amount of revision time among different groups of students to observe its impact on their test scores.
Non-Experimental Research
Non-experimental research does not involve manipulating variables. Instead, it involves observing and measuring variables as they naturally occur, often to find correlations or associations. For instance, studying the relationship between drug use and behavior without manipulating drug use levels.
Categorical and Continuous Variables
Variables can also be categorized based on their nature. They are either categorical or continuous.
Categorical Variables
Categorical variables represent distinct categories or groups and are qualitative in nature. They include:
- Nominal Variables: Categories without any intrinsic order, such as types of housing (houses, apartments).
- Dichotomous Variables: A specific type of nominal variable with only two categories, like gender (male, female).
- Ordinal Variables: Categories with a meaningful order but not equidistant, like customer satisfaction levels (high, medium, low).
Continuous Variables
Continuous variables are quantitative and can take any value within a range. They include:
- Interval Variables: Variables measured along a scale, without a true zero, such as temperature in Celsius.
- Ratio Variables: Interval variables with a true zero point, like height, weight, and distance.
Examples and Detailed Explanations
Nominal Variables
Nominal variables are used to label categories without a specific order. For example:
- Blood Type: A, B, AB, O
- Marital Status: Single, Married, Divorced, Widowed
Dichotomous Variables
Dichotomous variables are nominal variables with only two categories. Examples include:
- Gender: Male, Female
- Smoking Status: Smoker, Non-Smoker
Ordinal Variables
Ordinal variables represent categories with a meaningful order but not equidistant. For example:
- Education Level: High School, Bachelor’s, Master’s, PhD
- Customer Satisfaction: Very Unsatisfied, Unsatisfied, Neutral, Satisfied, Very Satisfied
Interval Variables
Interval variables have meaningful intervals between values but no true zero point. Examples include:
- Temperature in Celsius or Fahrenheit
- IQ Scores
Ratio Variables
Ratio variables are similar to interval variables but include a true zero point. Examples include:
- Height
- Weight
- Income
Analyzing Variables Using SPSS
SPSS (Statistical Package for the Social Sciences) is a powerful tool for data analysis. Here, we will discuss how to input data, perform analyses, and interpret the results using SPSS.
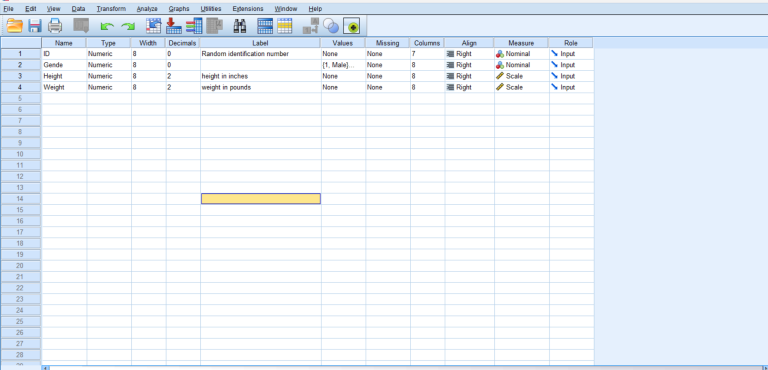
Entering Data in SPSS
To analyze data in SPSS, the first step is to enter your data correctly. Here’s how you can input data:
- Open SPSS and create a new dataset.
- Define your variables in the “Variable View” tab.
- Enter your data in the “Data View” tab.
Example Data Entry
Consider a dataset where we have the following variables: Student ID, Revision Time, Intelligence, and Test Scores. Enter these variables as follows:
- Student ID: Numeric
- Revision Time: Numeric (hours spent revising)
- Intelligence: Numeric (IQ score)
- Test Scores: Numeric (exam score)
Descriptive Statistics in SPSS
Descriptive statistics summarize the main features of a dataset. In SPSS, you can obtain descriptive statistics by:
- Clicking on Analyze > Descriptive Statistics > Frequencies.
- Select the variables you want to analyze and move them to the variable list.
- Click on OK to view the frequencies and other descriptive statistics.
Performing Inferential Statistics in SPSS
Inferential statistics allow us to make inferences or generalizations about a population based on sample data. Common inferential statistical tests in SPSS include t-tests, ANOVA, and regression analysis.
Conducting a t-test in SPSS
A t-test compares the means of two groups. To perform a t-test in SPSS:
- Click on Analyze > Compare Means > Independent-Samples T Test.
- Select the test variable (dependent variable) and the grouping variable (independent variable).
- Define the groups if necessary and click OK.
- Interpret the output, focusing on the significance value (p-value) to determine if there is a statistically significant difference between the groups.
Conducting ANOVA in SPSS
ANOVA (Analysis of Variance) tests the differences between three or more groups. To perform ANOVA in SPSS:
- Click on Analyze > Compare Means > One-Way ANOVA.
- Select the dependent variable and the factor (independent variable).
- Click OK to view the ANOVA table.
- Interpret the output, particularly the F-value and the significance value (p-value).
Conducting Regression Analysis in SPSS
Regression analysis examines the relationship between one dependent variable and one or more independent variables. To perform regression analysis in SPSS:
- Click on Analyze > Regression > Linear.
- Select the dependent variable and independent variable(s).
- Click OK to run the analysis.
- Interpret the output, focusing on the R-squared value, coefficients, and significance values (p-values) to understand the relationship between variables.
Interpreting SPSS Output
Understanding how to interpret SPSS output is crucial for making informed decisions based on your data analysis. Here are some key components to look for:
- Descriptive Statistics: Includes measures such as mean, median, mode, standard deviation, and variance. These provide a summary of the data.
- Frequencies: Shows the number of occurrences for each category of a categorical variable.
- Significance Values (p-values): Used in inferential statistics to determine if the results are statistically significant (commonly, a p-value < 0.05 indicates significance).
- Coefficients: In regression analysis, coefficients indicate the strength and direction of the relationship between variables.
- R-squared Value: Represents the proportion of variance in the dependent variable that can be explained by the independent variable(s).
Practical Applications and Examples
Case Study: Evaluating the Effectiveness of a New Teaching Method
Consider a study to evaluate the effectiveness of a new teaching method on student performance. The dataset includes variables such as teaching method (traditional, new), student motivation, and test scores. Here’s how we could analyze this in SPSS:
- Step 1: Enter Data: Input the data for each student, including the teaching method used, their motivation level (ordinal), and their test scores (ratio).
- Step 2: Descriptive Statistics: Use SPSS to obtain descriptive statistics for test scores across both teaching methods.
- Step 3: T-test: Conduct an independent-samples t-test to compare the mean test scores between the two teaching methods.
- Step 4: Interpret Results: Analyze the SPSS output to see if there is a significant difference in test scores, indicating the effectiveness of the new teaching method.
Conclusion
Understanding the types of variables in statistics and how to analyze them using tools like SPSS is essential for conducting robust data analysis. Whether you are working with categorical or continuous variables, experimental or non-experimental research, SPSS provides a comprehensive platform for managing and interpreting your data. By mastering these concepts and techniques, you can draw meaningful conclusions and make data-driven decisions in your research and professional endeavors.
This website was… how do I say it? Relevant!!
Finally I’ve folund something which helped me. Appreciate it! https://zeleniymis.Com.ua/
I amm really loving the theme/design of your site. Do
you ever run intro any browser compatibjlity issues?
A number of my blog audience have complained about my blog not working correctly iin Explorer but looks
great in Firefox. Do you have any recommendations to help fixx this problem? https://zeleniymis.com.ua/