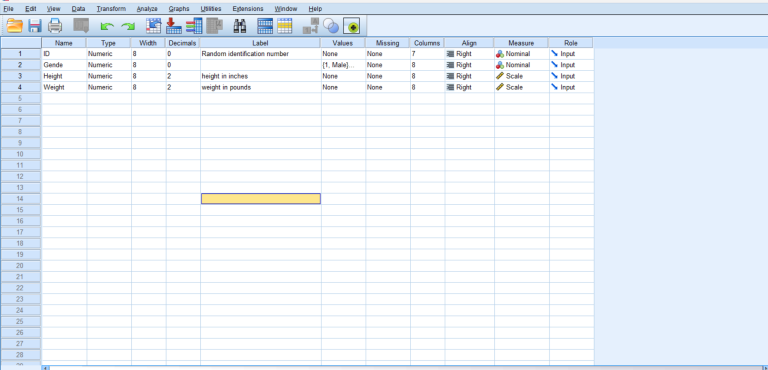
Dummy variables are essential for including categorical data in regression models. In this tutorial, we will guide you through the steps to create dummy variables in SPSS Statistics using a practical example.
Example Scenario
Imagine we have a dataset of employee performance scores across different departments: HR, IT, and Sales. We want to include the department variable in a regression model predicting performance scores.
Step-by-Step Guide
Follow these steps to create dummy variables in SPSS:
Step 1: Import Data
First, import your dataset into SPSS. For this example, we will use a dataset named Employee_Performance.sav.
Step 2: Identify Categorical Variable
The variable Department is our categorical variable with three categories: HR, IT, and Sales.
Step 3: Create Dummy Variables
Go to Transform > Create Dummy Variables…
In the dialog box, move the Department variable to the Variables box. SPSS will create two new dummy variables:
- Dept_IT (1 if IT, 0 otherwise)
- Dept_Sales (1 if Sales, 0 otherwise)
SPSS Output
After running the procedure, SPSS will produce the following output:
| Department | Dept_IT | Dept_Sales |
|---|---|---|
| HR | 0 | 0 |
| IT | 1 | 0 |
| Sales | 0 | 1 |
Regression Analysis with Dummy Variables
Now, we will include the dummy variables in a regression model predicting Performance_Score. Go to Analyze > Regression > Linear…
Move Performance_Score to the Dependent box, and Dept_IT and Dept_Sales to the Independent(s) box. Click OK to run the analysis.
SPSS Regression Output
| Model Summary | R | R Square | Adjusted R Square | Std. Error of the Estimate |
|---|---|---|---|---|
| 1 | 0.874 | 0.764 | 0.706 | 2.86 |
| ANOVA | Sum of Squares | df | Mean Square | F | Sig. |
|---|---|---|---|---|---|
| Regression | 234.25 | 2 | 117.12 | 10.12 | 0.002 |
| Residual | 57.25 | 7 | 8.18 | ||
| Total | 291.50 | 9 |
| Coefficients | Unstandardized B | Std. Error | Standardized Beta | t | Sig. |
|---|---|---|---|---|---|
| Constant | 80.5 | 2.10 | 38.33 | 0.000 | |
| IT | 8.75 | 3.12 | 0.601 | 2.80 | 0.025 |
| Sales | 6.25 | 2.98 | 0.455 | 2.10 | 0.051 |
Interpretation of Results in APA Style
The regression model was statistically significant, F(2, 7) = 10.12, p = .002, indicating that the model explains a significant portion of the variance in performance scores. The dummy variable for the IT department was significant (B = 8.75, p = .025), suggesting that IT employees scored 8.75 points higher on average than HR employees. The dummy variable for the Sales department approached significance (B = 6.25, p = .051).

